Thursday, May 27, 2010

Postprandial glucose levels, HbA1c, and arterial stiffness: Compared to glucose, lipids are not even on the radar screen

Postprandial glucose levels are the levels of blood glucose after meals. In Western urban environments, the main contributors to elevated postprandial glucose are foods rich in refined carbohydrates and sugars. While postprandial glucose levels may vary somewhat erratically, they are particularly elevated in the morning after breakfast. The main reason for this is that breakfast, in Western urban environments, is typically very high in refined carbohydrates and sugars.

HbA1c, or glycated hemoglobin, is a measure of average blood glucose over a period of a few months. Blood glucose glycates (i.e., sticks to) hemoglobin, a protein found in red blood cells. Red blood cells are relatively long-lived, lasting approximately 3 months. Thus HbA1c (given in percentages) is a good indicator of average blood glucose levels, if you don’t suffer from anemia or a few other blood abnormalities.

Based on HbA1c, one can then estimate his or her average blood glucose level for the previous 3 months or so before the test, using one of the following equations, depending on whether the measurement is in mg/dl or mmol/l.

Average blood glucose (mg/dl) = 28.7 × HbA1c − 46.7
Average blood glucose (mmol/l) = 1.59 × HbA1c − 2.59

Elevated blood glucose levels cause damage in the body primarily through glycation, which leads to the formation of advanced glycation endproducts (AGEs). Given this, HbA1c can be seen as a proxy for the level of damage done by elevated blood glucose levels to various body tissues. This damage occurs over time; often after many years of high blood glucose levels. It includes kidney damage, neurological damage, cardiovascular damage, and damage to the retina.

Most regular blood exams focus on fasting blood glucose as a measure of glucose metabolism status. Many medical practitioners have as a target a fasting blood glucose level of 125 mg/dl (7 mmol/l) or less, and largely disregard postprandial glucose levels or HbA1c in their management of glucose metabolism. Leiter and colleagues (2005; full reference at the end of this post) showed that this focus on fasting blood glucose is a mistake. They are not alone; many others made this point, including some very knowledgeable bloggers who focus on diabetes (see “Interesting links” section of this blog). Leiter and colleagues (2005) also provided some interesting graphs and figures, including eye-opening correlations between various variables and arterial stiffness. The figure below (click to enlarge) shows the contribution of postprandial glucose to HbA1c.


Note that the lower the HbA1c is in the figure (horizontal axis), the higher is the postprandial glucose contribution to HbA1c. And, the lower the HbA1c, the closer the individuals are to what one could consider having a perfectly normal HbA1c level (around 5 percent). That is, only for individuals whose HbA1c levels are very high, fasting blood glucose levels are relatively reliable measures of the tissue damage done be elevated blood glucose levels.

The table below (click to enlarge) shows P values associated with the impact of various variables (listed on the leftmost column) on arterial stiffness. This measure, arterial stiffness, is strongly associated with an increased risk of cardiovascular events. Look at the middle column showing P values adjusted for age and height. The lower the P value, the more a variable affects arterial stiffness. The variable with the lowest P value by far is 2-hour postprandial blood glucose; the blood glucose levels measured 2 hours after meals.


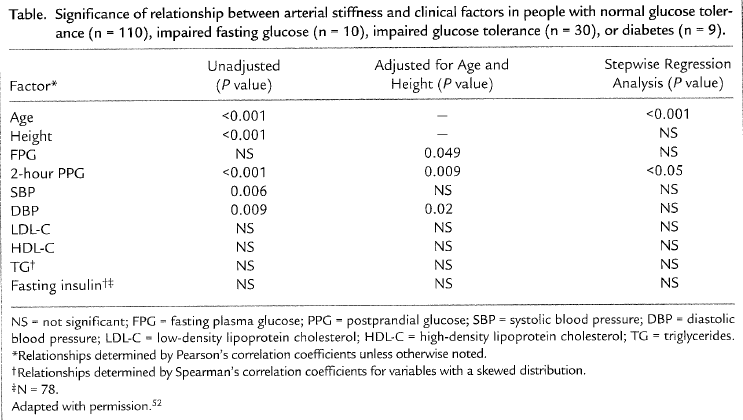
Fasting glucose levels were reported to be statistically insignificant because of the P = 0.049, in terms of their effect on arterial stiffness, but this P value is actually significant, although barely, at the 0.05 level (95 percent confidence). Interestingly, the following measures are not even on the radar screen, as far as arterial stiffness is concerned: systolic blood pressure, LDL cholesterol, HDL cholesterol, triglycerides, and fasting insulin levels.

What about the lipid hypothesis, and the “bad” LDL cholesterol!? This study is telling us that these are not very relevant for arterial stiffness when we control for the effect of blood glucose measures. Not even fasting insulin levels matters much! Wait, not even HDL!!! A high HDL has been definitely shown to be protective, but when we look at the relative magnitude of various effects, the story is a bit different. A high HDL’s protective effect exists, but it is dwarfed by the negative effect of high blood glucose levels, especially after meals, in the context of cardiovascular disease.

What all this points at is what we could call a postprandial glucose hypothesis: Lower your postprandial glucose levels, and live a longer, healthier life! And, by the way, if your postprandial glucose levels are under control, lipids do not matter much! Or maybe your lipids will fall into place, without any need for statin drugs, after your postprandial glucose levels are under control. One way or another, the outcome will be a positive one. That is what the data from this study is telling us.

How do you lower your postprandial glucose levels?

A good way to start is to remove foods rich in refined carbohydrates and sugars from your diet. Almost all of these are foods engineered by humans with the goal of being addictive; they usually come in boxes and brightly colored plastic wraps. They are not hard to miss. They are typically in the central aisles of supermarkets. The sooner you remove them from your diet, the better. The more completely you do this, the better.

Note that the evidence discussed in this post is in connection with blood glucose levels, not glucose metabolism per se. If you have impaired glucose metabolism (e.g., diabetes type 2), you can still avoid a lot of problems if you effectively control your blood glucose levels. You may have to be a bit more aggressive, adding low carbohydrate dieting (as in the Atkins or Optimal diets) to the removal of refined carbohydrates and sugars from your diet; the latter is in many ways similar to adopting a Paleolithic diet. You may have to take some drugs, such as Metformin (a.k.a. Glucophage). But you are certainly not doomed if you are diabetic.

Reference:

Leiter, L.A., Ceriello, A., Davidson, J.A., Hanefeld, M., Monnier, L., Owens, D.R., Tajima, N., & Tuomilehto, J. (2005). Postprandial glucose regulation: New data and new implications. Clinical Therapeutics, 27(2), S42-S56.

Wednesday, May 26, 2010

Oven roasted meat: Pork tenderloin

This cut of pork is the equivalent in the pig of the filet mignon in cattle. It is just as soft, and lean too. A 100 g portion of roasted pork tenderloin will have about 22 g of protein, and 6 g of fat. Most of the fat will be monounsaturated and saturated, and some polyunsaturated. The latter will contain about 450 mg of omega-6 and 15 mg of omega-3 fats in it.

The saturated fat is good for you. The omega-6-to-omega-3 ratio is not a great one, but a 100 g portion will have a small absolute amount of omega-6 fats, which can be easily offset with some omega-3 from seafood or a small amount of fish oil. Pork tenderloin is easy to find in supermarkets, and is much less expensive than filet mignon, even though it is a relatively expensive cut of meat.

Below are the before and after photos of a roasted pork tenderloin we prepared and ate recently; a simple recipe follows the photos. This type of cooking leads to a Maillard reaction, which is clear from the browning of the meat and around it on the casserole. I am not too concerned; more about this after the recipe.


Below is the simple recipe. The roasted pork pieces come off easily after the roasting is done, and almost melt in the mouth!

- Make about 10 holes on 2 lbs of pork tenderloin, and add chopped garlic pieces into each of them.
- Pour about a cup of salsa evenly over the pork tenderloin pieces.
- Cover roasting container (casserole in photos) with aluminum foil to preserve moisture.
- Preheat over to 375 degrees Fahrenheit.
- Roast the pork tenderloin for about 3 hours.

Now back to the Maillard reaction. When it happens inside the body, it is a step in the formation of advanced glycation endproducts (AGEs), which is not very good, as AGEs are believed to cause accelerated aging. However, the evidence that cooked meat is unhealthy, in the absence of leaky gut problems, is very slim. There are many hypothesized causes of the leaky gut syndrome, one of which is consumption of refined wheat products.

Our Paleolithic ancestors must have eaten charred meat on a regular basis, so it does not make much evolutionary sense to think that eating roasted meat leads to accelerated aging through the ingestion of AGEs. It is possible that eating charred meat caused health problems for our ancestors, and they threw their meat in the fire and then ate it charred anyway. Perhaps the health problems caused by charring were offset by the benefits of killing parasites living in meat with the heat of fire.

This is an open issue that needs much more research. Based on most of the research I have seen so far, eating roasted meat is not even in the same universe, in terms of the health problems that it can possibly generate, as is eating foods rich in refined carbohydrates and sugars (e.g., white bread, bagels, pasta, and non-diet sodas).

Monday, May 24, 2010

Intermittent fasting, engineered foods, leptin, and ghrelin

Engineered foods are designed by smart people, and the goal is not usually to make you healthy; the goal is to sell as many units as possible. Some engineered foods are “fortified” with the goal of making them as healthy as possible. The problem is that food engineers are competing with many millions of years of evolution, and evolution usually leads to very complex metabolic processes. Evolved mechanisms tend to be redundant, leading to the interaction of many particles, enzymes, hormones etc.

Natural foods are not designed to make you eat them nonstop. Animals do not want to be eaten (even these odd-looking birds below). Most plants do not “want” their various nutritious parts to be eaten. Fruits are exceptions, but plants do not want one single individual to eat all their fruits. That compromises seed dispersion. Multiple individual fruit eaters enhance seed dispersion. Plants "want" one individual animal to eat some of their fruits and then move on, so that other individuals can also eat.

(Source: Teamsugar.com)

It is safe to assume that doughnut manufacturers want one single individual to eat as many doughnuts as possible, and many individuals to want to do that. That takes some serious food engineering, and a lot of testing. Success will increase the manufacturers' revenues, the real bottom line for them. The medical establishment will then take care of those individuals, and prolong their miserable lives so that they can continue eating doughnuts for as long as possible. It is self-perpetuating system.

As mentioned in this previous post, to succeed in the practice of intermittent fasting, one has to stop worrying about food, and one good step in that direction is to avoid engineered foods. In this sense, intermittent fasting can be seen as a form of liberation. Doing something enjoyable and forgetting about food. Like children playing outdoors; they do not care as much about food as they do about play. Even sleeping will do; most people forget about eating when they are asleep.

Intermittent fasting as a religious and/or social activity, as in the Great Lent and Ramadan, also seems to work well. Any activity that brings people together with a common goal, especially if the goal is not to do something evil, has a lot of potential for success.

If you approach intermittent fasting as another thing to worry about, then it will be tough – one fast per week, on the same day of the week, from 7.33 pm of one day to 3.17 pm of the next day. I exaggerate a bit. Anyway, if you approach it as another obligation, another modern stressor, you will probably fail in the medium to long term. It is just commonsense. Maybe you will be able to do it for a while, but not for long enough to reap some serious benefits. A few fasts are not going to make you lose a lot of weight; the body will adapt in a compensatory way during the fast, slowing down your metabolism a bit and conserving calories. On top of that, you will feel very, very hungry. That will make you binge when you break your fast. Compensatory adaptation (a very general phenomenon) is something that our body is very good at, regardless of what we want it to do.

From a more pragmatic perspective, for most people it is easier to fast at night and in the morning. Eating a big meal right after you wake up is not a very natural activity; several hormones that promote body fat catabolism are often elevated in the morning, causing mild physiological insulin resistance.

If you have dinner at 7 pm, skip breakfast, and then have brunch the next day at 10 am, you will have fasted for 15 h. If you skip breakfast and brunch, and have lunch at noon the next day, you will have fasted for 17 h.

On the other hand, if you have breakfast at 8 am, skip lunch, and then have dinner at 6 pm, you will have fasted only for 10 h.

Leptin levels seem to go down significantly after 12 h of fasting, leading to increased body fat catabolism and leptin sensitivity. This is a good thing, since leptin resistance seems to frequently precede insulin resistance.

Many people think that skipping breakfast will make them fat, for various reasons, including that being what sumo wrestlers do to put on enormous amounts of body fat. Well, skipping breakfast probably will make people fat if, when they break the fast, they stuff themselves to the point of almost throwing up, combine plenty of easily digestible carbohydrates (e.g., multiple bowls of rice) with a lot of dietary fat, and then go to sleep. That is what sumo wrestlers normally do.

Eating fat is great, but not together with lots of easily digestible carbohydrates. Even eating a lot of fat by itself will make it difficult for you to shed enough fat to look like the hunter-gatherers in this post. But your body fat set point will be much lower if you eat a lot of fat by itself than if you eat a lot of fat with a lot of easily digestible carbohydrates.

Anyway, if people skip breakfast and eat what they normally eat at lunch, they will not gain more body fat than they would have if they had breakfast. If they do anything to boost their metabolism in the morning, they will most certainly lose body fat in a noticeable way over several weeks, as long as they have enough fat to lose. For example, they can add some light activity in the morning (such as walking), or have a metabolism-boosting drink (e.g., coffee, green tea), or both.

Our hunter-gatherer ancestors, living outdoors, probably spent most of their day performing light activities that involved little stress. Those activities increase metabolism and fat burning, while keeping stress hormone levels at low ranges. Hunger suppression was the result, making intermittent fasting fairly easy.

Again, intermittent fasting should be approached as a form of liberation. You are no longer a slave of food.

It helps staying away from engineered foods as much as possible, because, again, they are usually engineered with food addiction in mind. I am talking primarily about foods rich in refined carbohydrates and sugars. They come in boxes and plastic bags with labels describing calories and macronutrient composition, which are often wrong or misleading.

Let us say we could transport a group of archaic Homo sapiens to a modern city, and feed them white bread, bagels, doughnuts, potato chips industrially fried in vegetable oils, and the like. Would they say “Yuck, how can these people eat this?” No, they would not. It would be heaven for them; they would want nothing else for the rest of their gustatorily happy but health-wise miserable lives.

While practicing intermittent fasting, it is probably a good idea to have fixed meal times, and skipping them from time to time. The reason is the hunger hormone ghrelin, secreted by the stomach (mostly) and pancreas to stimulate hunger and possibly prepare the digestive tract for optimal or quasi-optimal absorption of food. Its secretion appears to follow the pattern of habitual meals adopted by a person.

References:

Elliott, W.H., & Elliott, D.C. (2009). Biochemistry and molecular biology. 4th Edition. New York: NY: Oxford University Press.

Fuhrman, J., & Barnard, N.D. (1995). Fasting and eating for health: A medical doctor's program for conquering disease. New York, NY: St. Martin’s Press.

Friday, May 21, 2010

Atheism is a recent Neolithic invention: Ancestral humans were spiritual people

For the sake of simplicity, this post treats “atheism” as synonymous with “non-spiritualism”. Technically, one can be spiritual and not believe in any deity or supernatural being, although this is not very common. This post argues that atheism is a recent Neolithic invention; an invention that is poorly aligned with our Paleolithic ancestry.

Our Paleolithic ancestors were likely very spiritual people; at least those belonging to the Homo sapiens species. Earlier ancestors, such as the Australopithecines, may have lacked enough intelligence to be spiritual. Interestingly, often atheism is associated with high intelligence and a deep understanding of science. Many well-known, and brilliant, evolution researchers are atheists (e.g., Richard Dawkins).

Well, when we look at our ancestors, spirituality seems to have emerged as a result of increased intelligence.

Spirituality can be seen in cave paintings, such as the one below, from the Chauvet Cave in southern France. The Chauvet Cave is believed to have the earliest known cave paintings, dating back to about 30 to 40 thousand years ago. The painting below is on the cover of the book Dawn of art: The Chauvet Cave. (See the full reference for this publication and others at the end of this post.)


The most widely accepted theory of the origin of cave paintings is that they were used in shamanic or religious rituals. By and large, they were not used to convey information (e.g., as maps); and they are often found deep in caves, in areas that are almost inaccessible, ruling out a “decorative” artistic purpose. As De La Croix and colleagues (1991) note:
Researchers have evidence that the hunters in the caves, perhaps in a frenzy stimulated by magical rites and dances, treated the painted animals as if they were alive. Not only was the quarry often painted as pierced by arrows, but hunters actually may have thrown spears at the images, as sharp gouges in the side of the bison at Niaux suggest.
Niaux is another cave in southern France. Like the Chauvet Cave, it is full of prehistoric paintings. Even though those paintings are believed to be more recent, dating back to the end of the Paleolithic, they follow the same patterns seen almost everywhere in prehistoric art. The patterns point at a life that gravitates around spiritual rituals.

Isolated hunter-gatherers also provide a glimpse at our spiritual Paleolithic past. No isolated hunter-gatherer group has ever been found in which atheism was the predominant belief among its members. In fact, the life of most isolated hunter-gatherer groups that have been studied appears to have revolved around religious rituals. In many of these groups, shamans held a very high social status, and strongly influenced group decisions.

Finally, there is solid empirical evidence from human genetics and the study of modern human groups that: (a) “religiosity” may be coded into our genes, to a larger extent in some individuals than in others; and (b) those who are spiritual, particularly those who belong to a spiritual or religious group, have generally better health and experience lower levels of depression and stress (which likely influence health) than those who do not.

There was once an ape that became smart. It invented weapons, which greatly multiplied the potential for death and destruction of the ape’s natural propensity toward violence; violence often motivated by different religious and cultural beliefs held by different groups. It also invented delicious foods rich in refined carbohydrates and sugars, which slowly poisoned the ape’s body.

Could the recent invention of atheism have been just as unhealthy?

Surely religion has been at the source of conflicts that have caused much death and destruction. But is religion, or spirituality, really to be blamed? Many other factors can lead to a great deal of death and destruction, sometimes directly, other times indirectly – e.g., poverty and illiteracy.

References:

Brown, D.E. (1991). Human universals. New York, NY: McGraw-Hill.

Chauvet, J.M., Deschamps, E.B., & Hillaire, C. (1996). Dawn of art: The Chauvet Cave. New York, NY: Harry N. Abrams.

De La Croix, H., Tansey, R.G., & Kirkpatrick, D. (1991). Gardner’s art through the ages: Ancient, medieval, and non-European art. Philadelphia, PA: Harcourt Brace.

Gombrich, E.H. (2006). The story of art. London, England: Pheidon Press.

Murdock, G.P. (1958). Outline of world cultures. New Haven, CN: Human Relations Area Files Press.

Thursday, May 20, 2010

Cheese’s vitamin K2 content, pasteurization, and beneficial enzymes: Comments by Jack C.

The text below is all from commenter Jack C.’s notes on this post summarizing research on cheese. My additions are within “[ ]”. While the comments are there under the previous post for everyone to see, I thought that they should be in a separate post. Among other things, they provide an explanation for the findings summarized in the previous post.

***

During [the] cheese fermentation process the vitamin K2 (menaquinone) content of cheese is increased more than ten-fold. Vitamin K2 is anti-carcinogenic, reduces calcification of soft tissue (like arteries) and reduces bone fracture risk. So vitamin K2 in aged cheese provides major health benefits that are not present in the control nutrients. [Jack is referring to the control nutrients used in the study summarized in the previous post.]

Another apparent benefit of aged cheese is the breakdown of the peptide BCM7 (beta-casomorphin 7) which is present in the casein milk of most cows (a1 milk) in the U.S. BCM7 is a powerful oxidant and is highly atherogenic. (From "Devil in the Milk" by Keith Woodford.)

[P]asteurization is not necessary, for during the aging process, the production of lactic acid results in a drop in pH which destroys pathogenic bacteria but does not harm beneficial bacteria! Many benefits result.

In making aged cheese, the temperature [should] be kept to no more than 102 degrees F, the same temperature that the milk comes out of the cow. The many beneficial enzymes in milk (8 actually) therefore are not harmed and provide many health benefits. Lactoferrin, for example, destroys pathogenic bacteria by binding to iron (most pathogenic bacteria are iron loving) and also helps in absorption of iron. Lipase helps break down fats and reduces the load on the pancreas which produces lipase.

By federal law, milk that has not been pasteurized cannot be shipped across state lines [in the U.S.], but raw milk cheese can be legally shipped provided that it has been aged at least sixty days. Thus, in backward states like Alabama where I live that do not permit the sale of raw milk, you can get the same beneficial enzymes (well, almost) from aged cheese as from raw milk. And as you pointed out, cheese that is shrink-wrapped will keep a long time and can be easily shipped.

I buy most of my raw milk cheese from a small dairy in Elberta, Alabama, Sweet Home Farm, which produces a great variety of organic raw milk cheese from Guernsey cows that are fed nothing but grass. No grain, no antibiotics or growth hormones. There is nothing comparable in the way of milk that is available legally. The so called “organic” milk sold in stores is all ultra-pasteurized. Yuck.

Raw milk cheese is readily shipped. Sweet Home Farm does not ship cheese, so I have to go get it, 70 miles round trip. On occasion I buy raw milk cheese from Next Generation Dairy, a small coop in Minn. which promises that they do not raise the temperature of the cheese to more than 102 degrees F during manufacture. The cheese is modestly priced and can be shipped inexpensively.

Jack

Tuesday, May 18, 2010

Cheese consumption, visceral fat, and adiponectin levels

Several bacteria feed on lactose, the sugar found in milk, producing cheese for us as a byproduct of their feeding. This is why traditionally made cheese can be eaten by those who are lactose intolerant. Cheese consumption predates written history. This of course does not refer to processed cheese, frequently sold under the name “American cheese”. Technically speaking, processed cheese is not “real” cheese.

One reasonably reliable way of differentiating between traditional and processed cheese varieties is to look for holes. Cheese-making bacteria produce a gas, carbon dioxide, which leaves holes in cheese. There are exceptions though, and sometimes the holes are very small, giving the impression of no holes. Another good way is to look at the label and the price; usually processed cheese is labeled as such, and is cheaper than traditionally made cheese.

Cheese does not normally spoil; it ages. When vacuum-wrapped, cheese is essentially in “suspended animation”. After opening it, it is a good idea to store it in such a way as to allow it to “breathe”, or continue aging. Wax paper does a fine job at that. This property, extended aging, has made cheese a very useful source of nutrition for travelers in ancient times. It was reportedly consumed in large quantities by Roman soldiers.

Walther and colleagues (2008) provide a good review of the role of cheese in nutrition and health. The full reference is at the end of this post. They point out empirical evidence that cheese, particularly that produced with Lactobacillus helveticus (e.g., Gouda and Swiss cheese), contributes to lowering blood pressure, stimulates growth and development of lean body tissues (e.g., muscle), and has anti-carcinogenic properties.

The health-promoting effects of cheese were also reviewed by Higurashi and colleagues (2007), who hypothesized that those effects may be in part due to the intermediate positive effects of cheese on adiponectin and visceral body fat levels. They conducted a study with rats that supports those hypotheses.

In the study, they fed two groups of rats an isocaloric diet with 20 percent of fat, 20 percent of protein, and 60 percent of carbohydrate (in the form of sucrose). In one group, the treatment group, Gouda cheese (produced with Lactobacillus helveticus) was the main source of protein. In the other group, the control group, isolated casein was the main source of protein. The researchers were careful to avoid confounding variables; e.g., they adjusted the vitamin and mineral intake in the groups so as to match them.

The table below (click to enlarge) shows initial and final body weight, liver weight, and abdominal fat for both groups of rats. As you can see, the rats more than quadrupled in weight by the end of the 8-weight experiment! Abdominal fat was lower in the cheese group; one type of visceral fat, mesenteric, was significantly lower. Whole body weight-adjusted liver weight was higher in the cheese group. Liver weight increase is often associated with increased muscle mass. The rats in the cheese group were a little heavier on average, even though they had less abdominal fat.


The figure below shows adiponectin levels at the 4-week and 8-week marks. While adiponectin levels decreased in both groups, which was to be expected given the massive gain in weight (and probably body fat mass), only in the casein group the decrease in adiponectin was significant. In fact, the relatively small decrease in the cheese group is a bit surprising given the increase in weight observed.


If we could extrapolate these findings to humans, and this is a big “if”, one could argue that cheese has some significant health-promoting effects. There is one small problem with this study though. To ensure that the rats consumed the same number of calories, the rats in the casein group were fed slightly more sucrose. The difference was very small though; arguably not enough to explain the final outcomes.

This study is interesting because the main protein in cheese is actually casein, and also because casein powders are often favored by those wanting to put on muscle as part of a weight training program. This study suggests that the cheese-ripening process induced by Lactobacillus helveticus may yield compounds that are particularly health-promoting in three main ways – maintaining adiponectin levels; possibly increasing muscle mass; and reducing visceral fat gain, even in the presence of significant weight gain. In humans, reduced circulating adiponectin and increased visceral fat are strongly associated with the metabolic syndrome.

One caveat: if you think that eating cheese may help wipe out that stubborn abdominal fat, think again. This is a topic for another post. But, briefly, this study suggests that cheese consumption may help reduce visceral fat. Visceral fat, however, is generally fairly easy to mobilize (i.e., burn); much easier than the stubborn subcutaneous body fat that accumulates in the lower abdomen of middle-aged men and women. In middle-aged women, stubborn subcutaneous fat also accumulates in the hips and thighs.

Could eating Gouda cheese, together with other interventions (e.g., exercise), become a new weapon against the metabolic syndrome?

References:

Higurashi, S., Kunieda, Y., Matsuyama, H., & Kawakami, H. (2007). Effect of cheese consumption on the accumulation of abdominal adipose and decrease in serum adiponectin levels in rats fed a calorie dense diet. International Dairy Journal, 17(10), 1224–1231.

Walther, B., Schmid, A., Sieber, R., & Wehrmüller, K. (2008). Cheese in nutrition and health. Dairy Science Technology, 88(4), 389-405.

Saturday, May 15, 2010

Intermittent fasting as a form of liberation

I have been doing a lot of reading over the years on isolated hunter-gatherer populations; see three references at the end of this post, all superb sources (Chagnon’s book on the Yanomamo, in particular, is an absolute page turner). I also take every opportunity I have to talk with anthropologists and other researchers who have had field experience with hunter-gatherer groups. Even yesterday I was talking to a researcher who spent many years living among isolated native Brazilian groups in the Amazon.

Maybe I have been reading too much into those descriptions, but it seems to me that one distinctive feature of many adults in hunter-gatherer populations, when compared with adults in urban populations, is that the hunter-gatherers are a lot less obsessed with food.

Interestingly, this seems to be a common characteristic of physically active children. They want to play, and eating is often an afterthought, an interruption of play. Sedentary children, who play indoors, can and often want to eat while they play.

Perhaps adult hunter-gatherers are more like physically active children than adults in modern urban societies. Maybe this is one of the reasons why adult hunter-gatherers have much less body fat. Take a look at the photo below (click to enlarge), from Wikipedia. It was reportedly taken in 1939, and shows three Australian aboriginals.


Hunter-gatherers do not have supermarkets, and active children need food to grow healthy. Adult urbanites have easy access to an abundance of food in supermarkets, and they do not need food to grow, at least not vertically.

Still, adult hunter-gatherers and children who are physically active are generally much less concerned about food than adults in modern urban societies.

It seems illogical, a bit like a mental disorder of some sort that has been plaguing adults in modern urban societies. A mental disorder that contributes to making them obese.

Modern urbanites are constantly worried about food. And also about material possessions, bills, taxes etc. They want to accumulate as much wealth as their personal circumstances allow them, so that they can retire and pay for medical expenses. They must worry about paying for their children’s education. Food is one of their many worries; for many it is the biggest of them all. Too much food makes you fat, too little makes you lose muscle (not really true, but a widespread belief).

Generally speaking, intermittent fasting is very good for human health. Humans seem to have evolved to be episodic eaters, being in the fasted state most of the time. This is perhaps why intermittent fasting significantly reduces levels of inflammation markers, promotes the recycling of “messed up” proteins (e.g., glycated proteins), and increases leptin and insulin sensitivity. It is something natural. I am talking about fasting 24 h at a time (or a bit more, but not much more than that), with plenty of water but no calories. Even skipping a meal now and then, when you are busy with other things, is a form of intermittent fasting.

Now, the idea that our hominid ancestors were starving most of the time does not make a lot of sense, at least not when we think about Homo sapiens, as opposed to earlier ancestors (e.g., the Australopithecines). Even archaic Homo sapiens, dating back to 500 thousand years ago, were probably too smart to be constantly starving. Moreover, the African savannas, where Homo sapiens emerged, were not the type of environment where a smart and social species would be hungry for too long.

Yet, intermittent fasting probably happened frequently among our Homo sapiens ancestors, for the same reason that it happens among hunter-gatherers and active children today. My guess is that, by and large, our ancestors were simply not too worried about food. They ate it because they were hungry, probably at regular times – as most hunter-gatherers do. They skipped meals from time to time.

They certainly did not eat to increase their metabolism, raise their thyroid hormone levels, or have a balanced macronutrient intake.

There were no doubt special occasions when people gathered for a meal as a social activity, but probably the focus was on the social activity, and secondarily on the food.

Of course, they did not have doughnuts around, or foods engineered to make people addicted to them. That probably made things a little easier.

Successful body fat loss through intermittent fasting requires a change in mindset.

References:

Boaz, N.T., & Almquist, A.J. (2001). Biological anthropology: A synthetic approach to human evolution. Upper Saddle River, NJ: Prentice Hall.

Chagnon, N.A. (1977). Yanomamo: The fierce people. New York, NY: Holt, Rinehart and Winston.

Price, W.A. (2008). Nutrition and physical degeneration. La Mesa, CA: Price-Pottenger Nutrition Foundation.

Sunday, May 9, 2010

Long distance running causes heart disease, unless it doesn’t

Regardless of type of exercise, disease markers are generally associated with intensity of exertion over time. This association follows a J-curve pattern. Do too little of it, and you have more disease; do too much, and incidence of disease goes up. There is always an optimal point, for each type of exercise and marker. A J curve is actually a U curve, with a shortened left end. The reason for the shortened left end is that, when measurements are taken, usually more measures fall on the right side of the curve than on the left.

The figure below (click to enlarge) shows a schematic representation that illustrates this type of relationship. (I am not very good at drawing.) Different individuals have different curves. If the vertical axis was a measure of health, as opposed to disease, then the curve would have the shape of an inverted J.


The idea that long distance running causes heart disease has been around for a while. Is it correct?

If it is, then one would expect to see certain things. For example, let’s say you take a group of long distance runners who have been doing that for a while, ideally runners above age 50. That is when heart disease becomes more frequent. This would also capture more experienced runners, with enough running experience to cause some serious damage. Let us say you measured markers of heart disease before and after a grueling long distance race. What would you see?

If long distance running causes heart disease, you would see a significant proportion with elevated makers of heart disease among the runners at baseline (i.e., before the race). After all, running is causing a cumulative problem. The levels of those markers would be correlated with practice, or participation in previous races, since the races are causing the damage. Also, you would see a uniformly bad increase in the markers after the race, as the running is messing up everybody more or less equally.

Sahlén and colleagues (2009), a group of Swedish researchers, studied males and females aged 55 or older who participated in a 30-km (about 19-mile) cross-country race. The full reference to the article is at the end of this post. The researchers included only runners who had no diagnosed medical disorders in their study. They collected data on the patterns of exercise prior to the race, and participation in previous races. Blood was taken before and after the race, and several measurements were obtained, including measurements of two possible heart disease markers: N-terminal pro-brain natriuretic peptide (NT-proBNP), and troponin T (TnT). The table below (click to enlarge) shows several of those measurements before and after the race.


We can see that NT-proBNP and TnT increased significantly after the race. So did creatinine, a byproduct of breakdown in muscle tissue of creatine phosphate; something that you would expect after such a grueling race. Yep, long distance running increases NT-proBNP and TnT, so it leads to heart disease, right?

Wait, not so fast!

NT-proBNP and TnT levels usually increase after endurance exercise, something that is noted by the authors in their literature review. But those levels do not stay elevated for too long after the race. Being permanently elevated, that is a sign of a problem. Also, excessive elevation during the race is also a sign of a potential problem.

Now, here is something interesting. Look at the table below, showing the variations grouped by past participation in races.


The increases in NT-proBNP and TnT are generally lower in those individuals that participated in 3 to 13 races in the past. They are higher for the inexperienced runners, and, in the case of NT-proBNP, particularly for those with 14 or more races under their belt (the last group on the right). The baseline NT-proBNP is also significantly higher for that group. They were older too, but not by much.

Can you see a possible J-curve pattern?

Now look at this table below, which shows the results of a multiple regression analysis on its right side. Look at the last column on the right, the beta coefficients. They are all significant, but the first is .81, which is quite high for a standardized partial regression coefficient. It refers to an almost perfect relationship between the log of NT-proBNP increase and the log of baseline NT-proBNP. (The log transformations reflect the nonlinear relationships between NT-proBNP, a fairly sensitive health marker, and the other variables.)


In a multiple regression analysis, the effect of each independent variable (i.e., each predictor) on the dependent variable (the log of NT-proBNP increase) is calculated controlling for the effects of all the other independent variables on the dependent variable. Thus, what the table above is telling us is that baseline NT-proBNP predicts NT-proBNP increase almost perfectly, even when we control for age, creatinine increase, and race duration (i.e., amount of time a person takes to complete the race).

Again, even when we control for: AGE, creatinine increase, and RACE DURATION.

In order words, baseline NT-proBNP is what really matters; not even age makes that much of a difference. But baseline NT-proBNP is NEGATIVELY correlated with number of previous races. The only exception is the group that participated in 14 or more previous races. Maybe that was too much for them.

Okay, one more table. This one, included below, shows regression analyses between a few predictors and the main dependent variable, which in this case is TnT elevation. No surprises here based on the discussion so far. Look at the left part, the column labeled as “B”. Those are correlation coefficients, varying from -1 to 1. Which is the predictor with the highest absolute correlation with TnT elevation? It is number of previous races, but the correlation is, again, NEGATIVE.


In follow-up tests after the race, 9 out of the 185 participants (4.9 percent) showed more decisive evidence of heart disease. One of those died while training a few months after the race. An autopsy was conducted showing abnormal left ventricular hypertrophy with myocardial fibrosis, coronary artery narrowing, and an old myocardial scar.

Who were the 9 lucky ones? You guessed it. Those were the ones who had the largest increases in NT-proBNP during the race. And large increases in NT-proBNP were more common among the runners who were too inexperienced or too experienced. The ones at the extremes.

So, here is a summary of what this study is telling us:

- The 30-km cross-country race studied is no doubt a strenuous activity. So if you have not exercised in years, perhaps you should not start with this kind of race.

- By and large, individuals who had elevated markers of heart disease prior to the race also had the highest elevations of those markers after the race.

- Participation in past races was generally protective, likely due to compensatory body adaptations, with the exception of those who did too much of that.

- Prevalence of heart disease among the runners was measured at 4.9 percent. This does not beat even the mildly westernized Inuit, but certainly does not look so bad considering that the general prevalence of ischemic heart disease in the US and Sweden is about 6.8 percent.

It seems reasonable to conclude that long distance running may be healthy, unless one does too much of it. The ubiquitous J-curve pattern again.

How much is too much? It certainly depends on each person’s particular health condition, but the bar seems to be somewhat high on average: participation in 14 or more previous 30-km races.

As for the 4.9 percent prevalence of heart disease among runners, maybe it is caused by something else, and endurance running may actually be protective, as long as it is not taken to extremes. Maybe that something else is a diet rich in refined carbohydrates and sugars, or psychological stress caused by modern life, or a combination of both.

Just for the record, I don’t do endurance running. I like walking, sprinting, moderate resistance training, and also a variety of light aerobic activities that involve some play. This is just a personal choice; nothing against endurance running.

Mark Sisson was an accomplished endurance runner; now he does not like it very much. (Click here to check his excellent book The Primal Blueprint). Arthur De Vany is not a big fan of endurance running either.

Still, maybe the Tarahumara and hunter-gatherer groups who practice persistence hunting are not such huge exceptions among humans after all.

Reference:

Sahlén, A., Gustafsson, T.P., Svensson, J.E., Marklund, T., Winter, R., Linde, C., & Braunschweig, F. (2009). Predisposing Factors and Consequences of Elevated Biomarker Levels in Long-Distance Runners Aged >55 Years. The American Journal of Cardiology, 104(10), 1434–1440.

Wednesday, May 5, 2010

Obesity protects against disease, unless you eat butter

Notes:

- This post is a joke, a weird parody of academic research, which is why it is labeled “humor” and is being filed under “Abstract humor”. In my reading of academic articles I often come across articles with a lot of problems – interpretation biases, idiotic self-citation, moronic research designs, misguided immodesty, exaggerated political correctness, fake markers of high moral standards, nonsensical quantitative analysis etc. I decided to write a short post on a fictitious study that has all of these problems (a challenge).

- I apologize for this spoiler. Some people probably like humor posts better if they do not know what they are in advance, but several others may think that reading a post like this is a waste of their time. If you are in the latter category, move on to another post! If not, here it goes …

***

New groundbreaking forthcoming research by Drs. Deth and Disis (full reference at the end of this post) shows beyond much doubt that obesity is protective against disease. The research also implicates butter as a powerful disease-promoting agent. The research is forthcoming in the journal Butter Toxicity Review.

(Sources: Topnews.us and Flickr.com)

The journal is listed as an “elite”-level journal on the website of the Society for Research on Butter and its Negative Health Effects (SRBNHE). I thank the researchers for sharing their findings with a select group of notable scholars, of which I can humbly say I am part, well in advance of its official publication. Another seminal study by the same researchers has been cited in this post.

The study followed 2,301 male participants over a period of 13.3 years. Their ages ranged from 20 to 37 years. Approximately half of them were morbidly obese, with body fat percentages of 60 or higher. That is, more than half of these individuals’ bodies were pure fat! These obese individuals were matched against an age-compatible control group of fit men with a mean body fat percentage of 9.2.

The focus of the study was on sexually transmitted diseases among individuals with high moral standards. Because of that, the researchers noted that: “A small group of individuals, who admitted to availing themselves of adult entertainment services, and/or services of a similarly immoral nature, were excluded from the study.”

Among the fit individuals, 15.7 percent contracted one or more types of sexually transmitted diseases during the 13.3-year period. Only 3.1 percent of the obese individuals contracted ANY sexually transmitted disease. This difference was statistically significant at the .001 level (i.e., very significant), even when the researchers controlled for various demographic factors.

Even more interesting were the patterns of risk-avoidance behavior observed. The vast majority of the fit individuals (84.3 percent, to be more precise) reported using protective items (i.e., condoms). However, NONE of the obese individuals used those. And yet, the obese individuals had significantly less incidence of sexually transmitted diseases.

The researchers concluded that: “It is abundantly clear from this research that obesity, especially at the levels found in this study, is protective against sexually transmitted diseases.”

There were only two apparent anomalies. Among the 3.1 percent of obese individuals who contracted sexually transmitted diseases, approximately 97 percent scored very high on “NTW”, a variable that measured the net worth in dollars of the individuals, including accumulated parental allowances.

The other 3 percent (of the 3.1 percent of obese individuals) scored low on NTW but very high on a latent variable called “FBC”, based on a perceptual 11-indicator, 7-point Likert scale measurement instrument, whose anchor indicator referred to the question-statement: “He is fat but cute.” The respondents for FBC were a random group of female protesters who threatened to denounce the study for what they alleged was discrimination against adult entertainers.

Regarding these apparent anomalies, the researchers noted that: “The association with FBC calls for additional research, and does not invalidate the overall results, since it involved a very small percentage of the individuals studied (3 percent of 3.1 percent, or 0.093 percent). However, we have strong reasons to believe that the association with NTW reflects an underlying predisposition toward elevated consumption of butter.”

The researchers cited previous theoretical research, which they also co-authored and published in the same elite journal, which provides a solid basis for this suspicion. That seminal theoretical research points to a clear but complex link between being very obese/rich and: (a) elevated butter consumption; and (b) susceptibility to diseases of any kind, caused by the elevated butter consumption.

Again, I would like to thank Drs. Deth and Disis for their advance sharing of their groundbreaking findings. Their brilliance is only matched by their humility; they noted at the end of their report that: “While this groundbreaking research clearly points to the protective effects of extreme obesity, and to one more possible negative effect of butter consumption, we believe that much more research is needed to further elucidate the nature of the negative effects of this known toxin.”

Reference:

Deth, R., & Disis, M. (forthcoming). STD incidence and obesity: The deleterious effect of butter consumption. Butter Toxicity Review.